Files in the delivery
| Deliverable | Format | What's in it | Cadence |
|---|---|---|---|
| Turbine point layer | Point layer, GeoPackage | One point per detected turbine at the estimated hub position. Fields: detection date, capture date of the image it was read from, and a confidence flag. It loads straight into QGIS or ArcGIS, and from there into the wake model or the constraints map. | Refreshed each quarter over the same AOI. |
| Pad and access road geometry | Polygon and line layers, GeoPackage | The cleared pad under each turbine as a polygon, and the access road that serves it as a line. Use them to check a setback line against the pad. | Quarterly |
| Fleet count | CSV | Detected turbines per site, per portfolio or per competitor project boundary you name in the AOI, with the capture date beside each count. | Counts move from one quarter to the next as strings go up. |
| Quarterly change layer | Point layer, GeoPackage | Turbines that appeared since the last pass, and turbines that no longer show. Open this one when an option comes up for renewal. | Quarterly |
How it works
AYou send
Send the AOI
Site, county, region, or a set of competitor project boundaries. Shapefile or GeoPackage. Tell us the coordinate system you want back.
BWe pull
Imagery pass
We pull the latest clear very-high-resolution capture over the AOI, satellite or aerial, in RGB.
CWe read
Detection
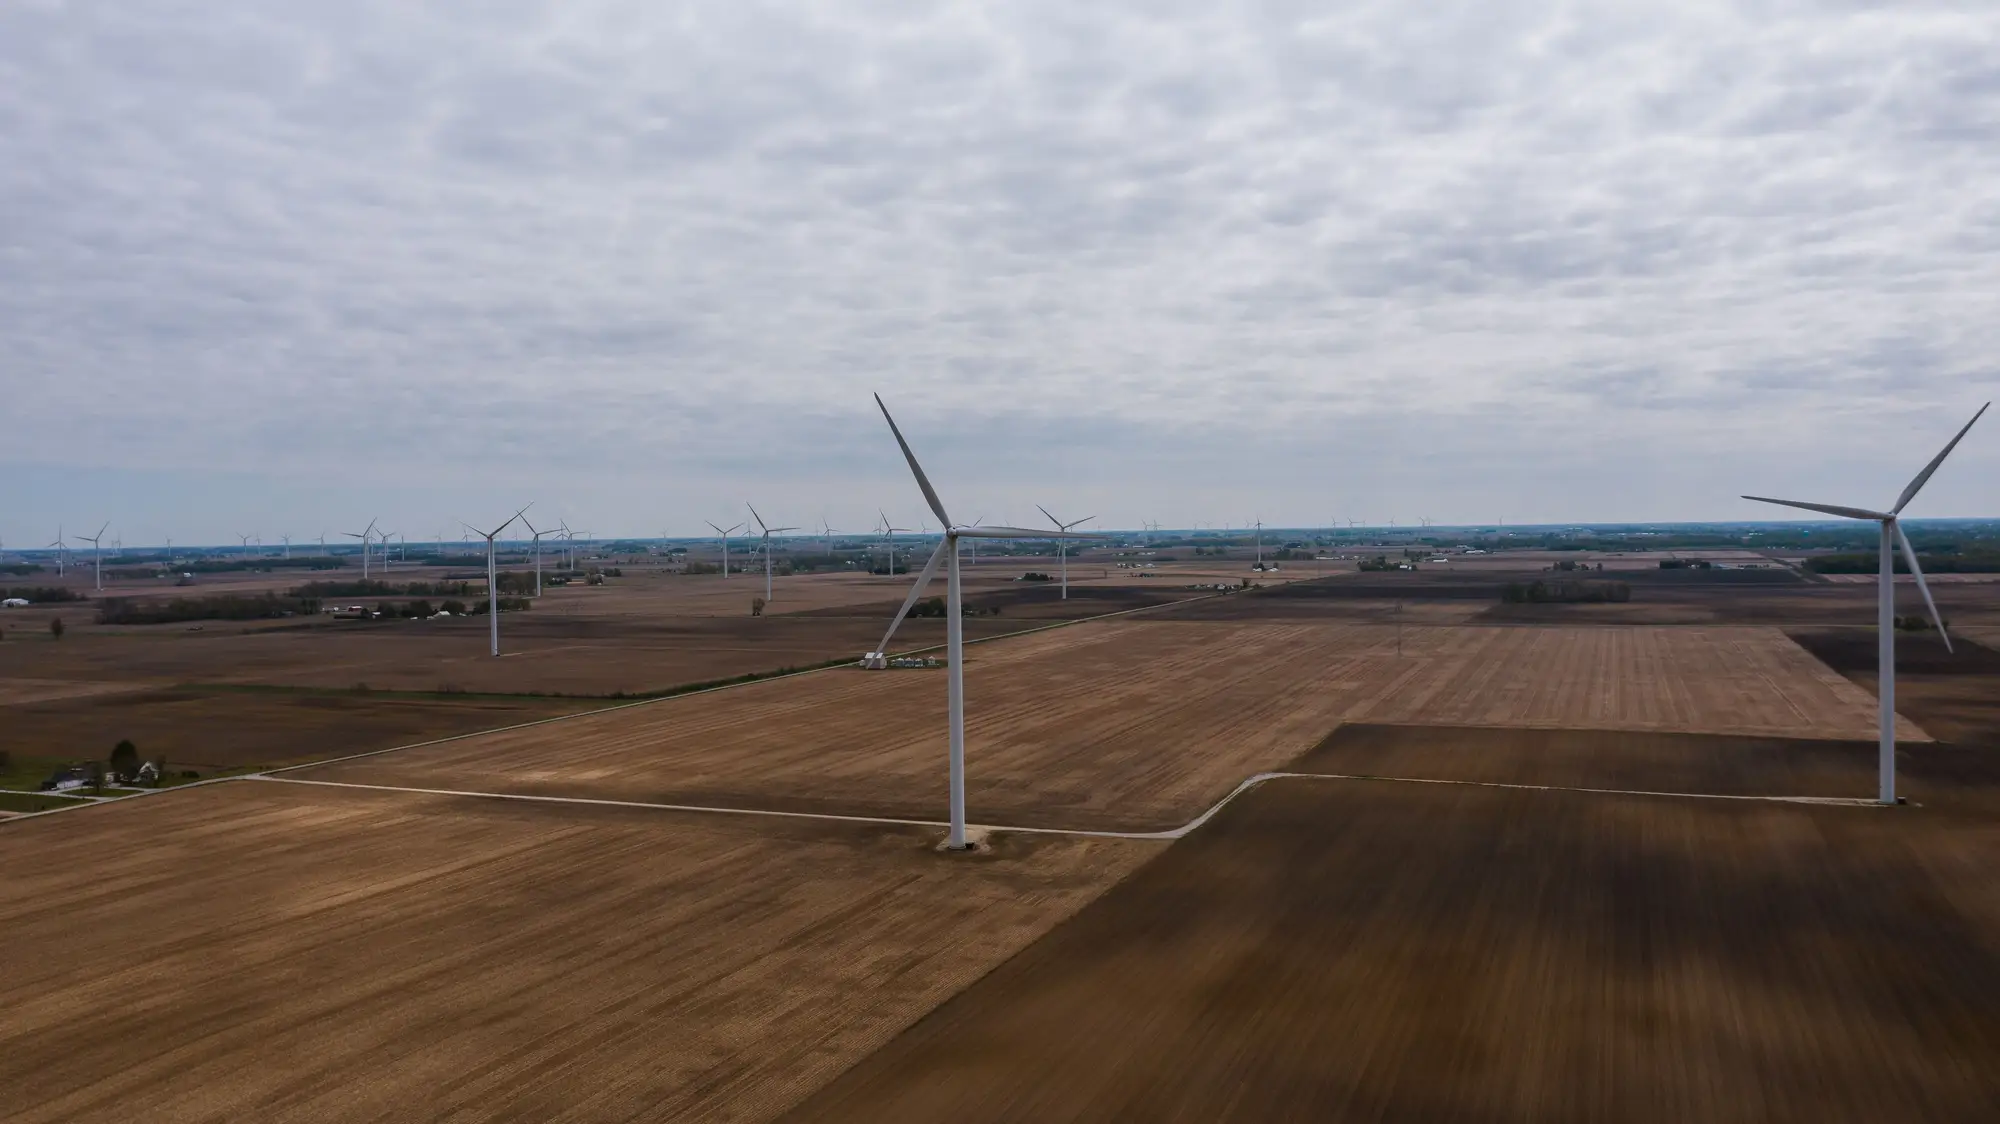
Towers and pads are found in the image. The hub position comes from the length and direction of the rotor shadow, read against the pad footprint.
DYou get
Delivery
Point layer, pad and road geometry, change layer and counts, each with the capture date for the area it covers. A new pass follows each quarter.
Limits
| Condition | Effect on the layer | What to expect |
|---|---|---|
| Cloud and haze | Optical imagery needs a clear pass. | A cloudy quarter can leave part of an AOI on the previous capture, and the delivery states the capture date for every tile. |
| Hub position is an estimate | Position comes from shadow and pad geometry, with no GPS on the turbine. Sun angle and steep terrain both move the estimate. | Don't use it where a survey-grade coordinate is required, such as a permit filing or a staking plan. |
| Construction in progress | A pad with no tower, or a tower with no blades, may not read as a turbine yet. | Strings still going up can be missed, or arrive a quarter late. |
| Position and pad only | The layer carries no manufacturer, model, hub height, rated capacity or output. | It says where a turbine stands. It does not say what it is. |
| Quarterly, not live | Quarterly is the target. | A turbine raised the week after a pass shows up on the next one, and this is not continuous tracking. |
| Resolution | At ≤0.5 m a pixel is under two feet. | A thin feature such as a met mast guy wire is below what the imagery resolves. |
Why this exists
Before an option is renewed you need to know what already stands around the parcel. The public turbine database and the FAA filings behind it trail construction, and operator fleet lists are self-reported.
So you open the basemap and click every tower by hand, then check the date stamp to see whether the newest string made it into the picture. The layer goes into the wake study and the land memo, and nobody can say how old it is.
Who it's for
Who it's for
- Siting analysts at wind developers who need turbine density around a candidate parcel or a competitor's project.
- GIS leads who hand a turbine layer to the energy yield team for the wake model.
- Portfolio analysts who count a fleet from imagery instead of waiting on disclosures.
Who it's not for
- Teams that need turbine model, hub height, rated capacity or generation output.
- Live or continuous tracking of construction.
- Survey-grade hub coordinates for engineering or permitting.
- Anyone replacing a regulatory filing. This is an independent read that sits beside the registry.
Questions from siting and GIS teams
Can you see turbines under cloud?
No. Optical imagery needs a clear pass. If a quarter is cloudy, the affected tiles keep the previous capture and say so.
Do you give turbine model or capacity?
No. Position and pad geometry only.
How is hub position derived?
From the length and direction of the rotor shadow, read against the pad footprint. It is an estimate, not GPS.
What about turbines under construction?
A pad without a tower may be missed. A later quarterly pass can pick it up once a tower or its shadow can be resolved.
Can this replace the public turbine database?
It sits beside it. Registries lag construction and imagery doesn't wait for filings, but this is not a regulatory record.
What coordinate system and formats do the layers use?
GeoPackage for the layers and CSV for the counts, in the coordinate system you name when the project is scoped. QGIS and ArcGIS both open them.
How do we check it against our own turbines?
Send the coordinates you hold for a site you know and compare them with the layer. We will set them side by side when the project is scoped.
Who owns the delivered layers, and how is it priced?
Use and ownership terms are written into the contract before work starts. Each AOI is scoped and quoted on its own, with a written scope for procurement.
Send the AOI and we'll tell you what's standing in it.
Or .