Notes for siting teams
Turbine layers, registries, wake studies and the land work around them.
Field notes: the ridge we almost passed on because the map still showed it empty
A ridge looked clear on every public registry. The imagery told a different story. Notes on disclosure lag and why stale turbine data costs you a site.
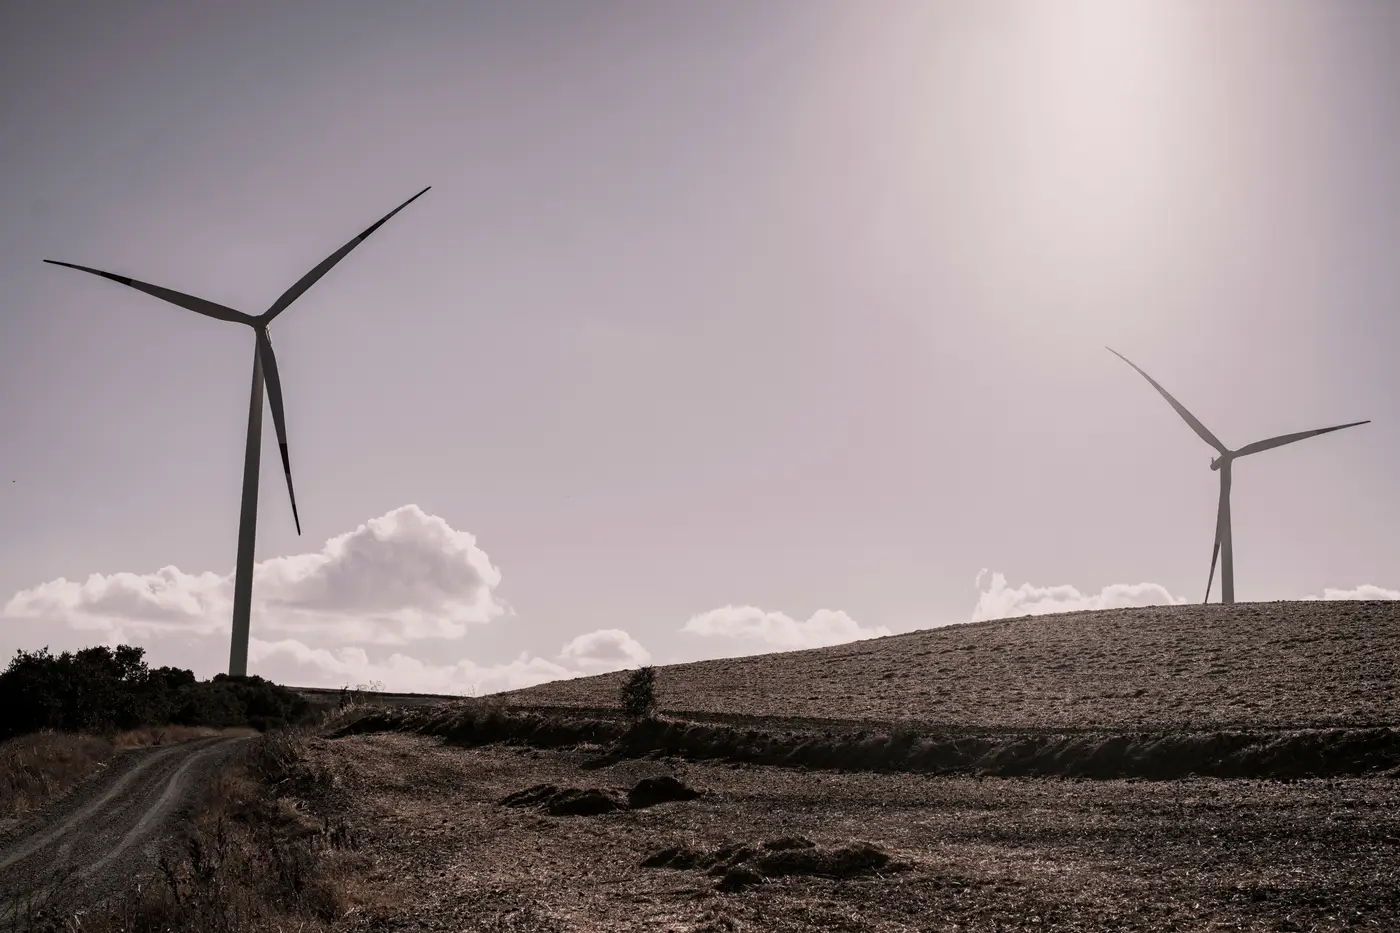
Pad geometry vs. rotor shadow: how satellite imagery actually finds a turbine
How turbine detection from imagery works: why rotor shadows and foundation pad signatures each catch some turbines and miss others, combined.

From point layer to wake-loss estimate: a siting workflow
A siting analyst's workflow for turning current turbine hub coordinates into a candidate-site wake-loss estimate, and why fleet lists lag construction.
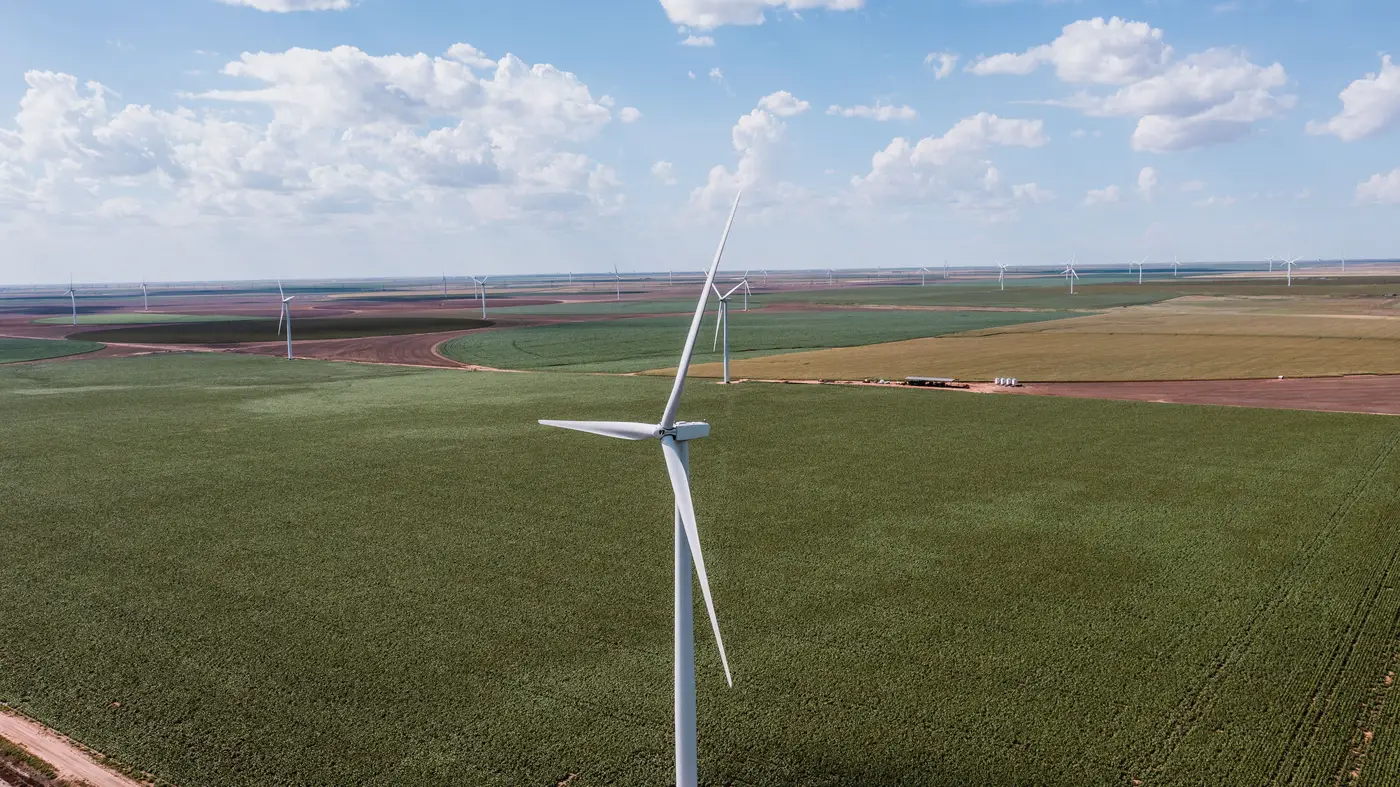
Why public turbine registries lag behind commissioning dates
A look at why public wind turbine registries run months or years behind actual commissioning, and what that lag means for siting work.
Field notes: the day our turbine count didn't match the developer's own GIS layer
A siting analyst's field notes on the week a turbine count disagreed with a developer's own GIS layer, and what that gap usually means.

How to count turbines on a candidate site from satellite imagery
A practical walkthrough for counting and verifying turbines on a candidate or competitor wind site using satellite imagery, without waiting on disclosures.
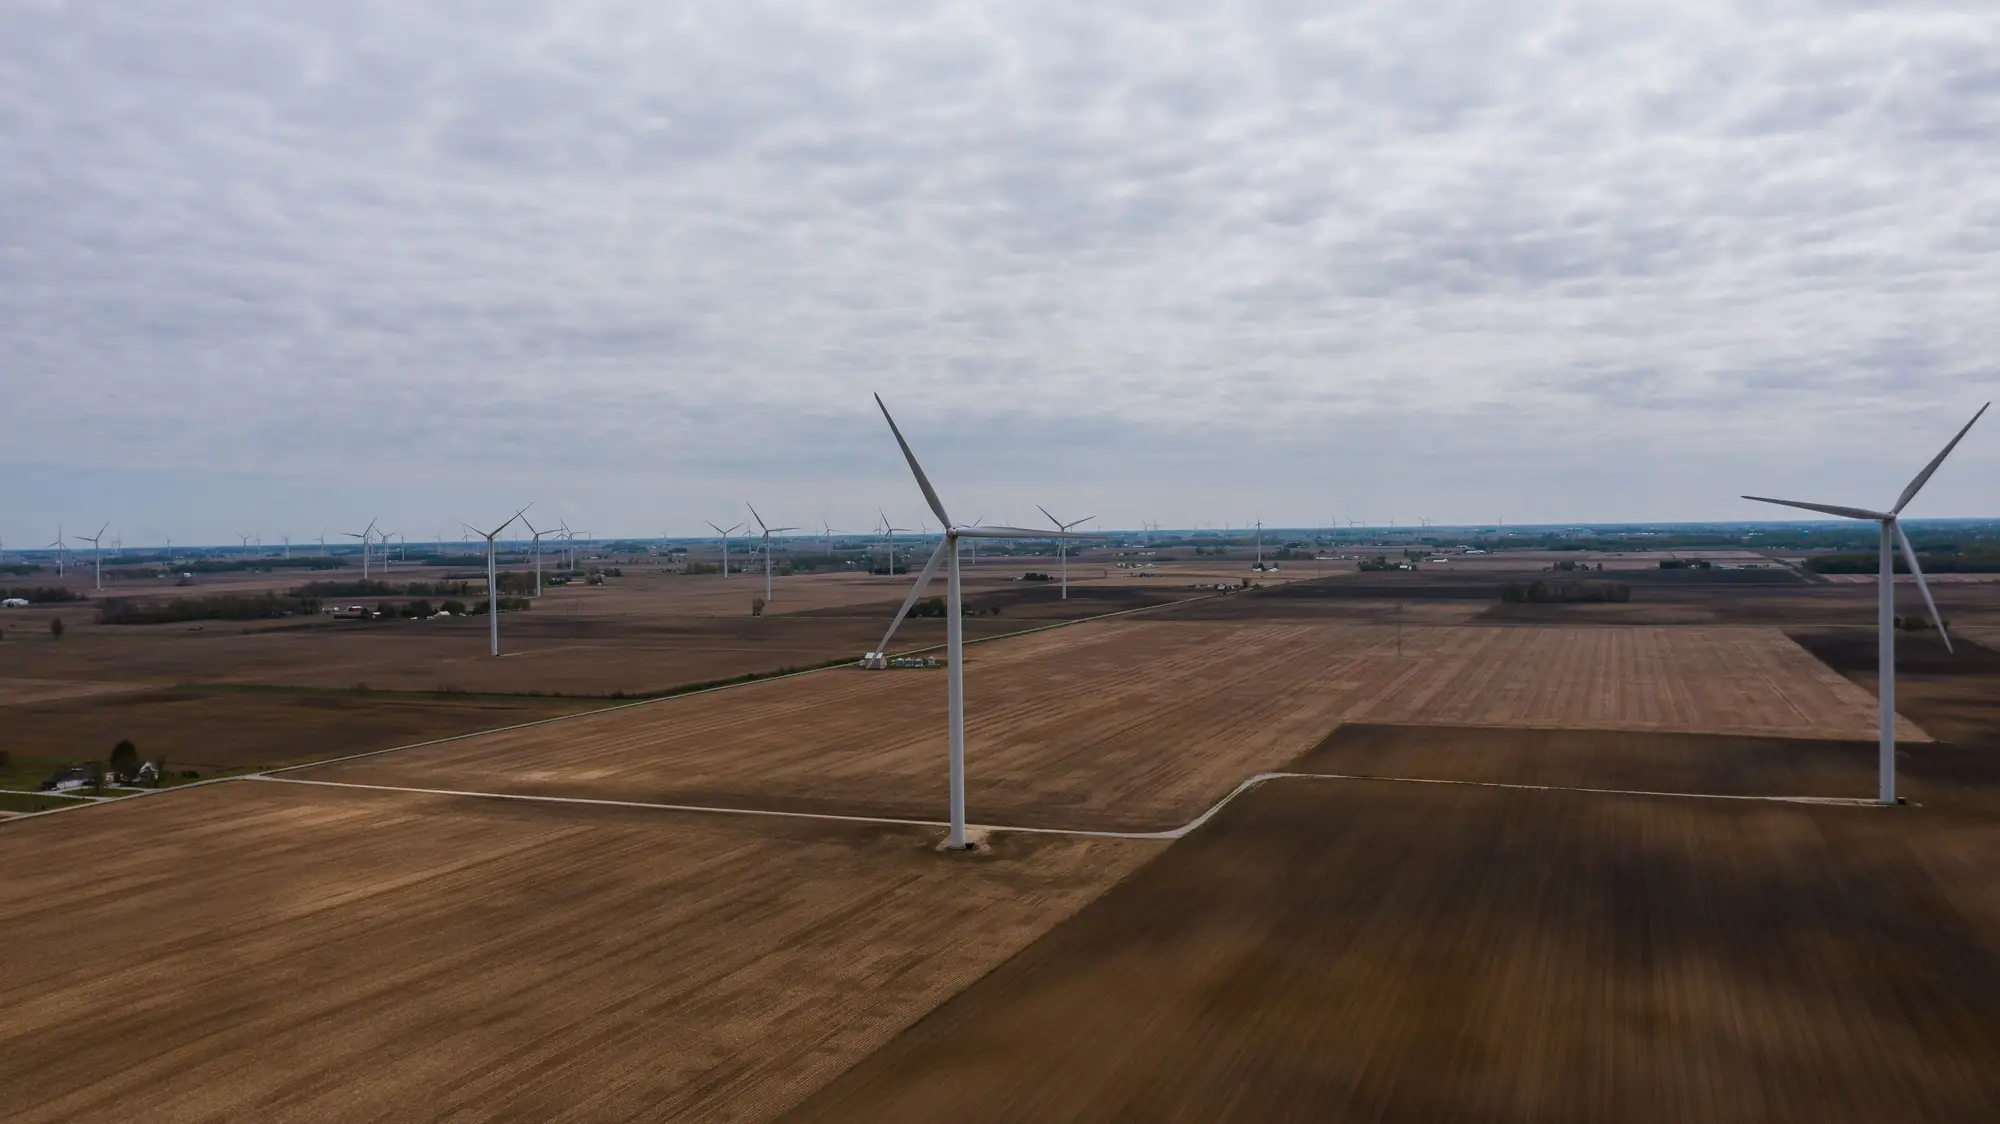
USWTDB vs. satellite turbine counts: how current is the public database?
USWTDB updates lag construction by months. Here's what causes the gap, what FAA obstruction data does and doesn't fill, and how to check current counts.
How to measure turbine spacing from satellite imagery
A working guide to pulling inter-turbine spacing, row geometry, and rotor diameter multiples directly off VHR satellite imagery.
How to tell an operating turbine from a decommissioned one in satellite imagery
Visual cues for spotting decommissioned wind turbines in satellite imagery, from missing blades to overgrown access roads and repowering tells.
Nameplate capacity vs. modeled capacity: reconciling a wind portfolio
Why the nameplate MW in a registry rarely matches what a wake-loss model needs, and how to reconcile a wind fleet capacity estimate without disclosures.
What is micrositing in wind farm layout design?
A field-level explanation of wind farm micrositing: setback rules, turbine spacing, wake losses, and why existing fleet positions change the layout math.