How to count turbines on a candidate site from satellite imagery
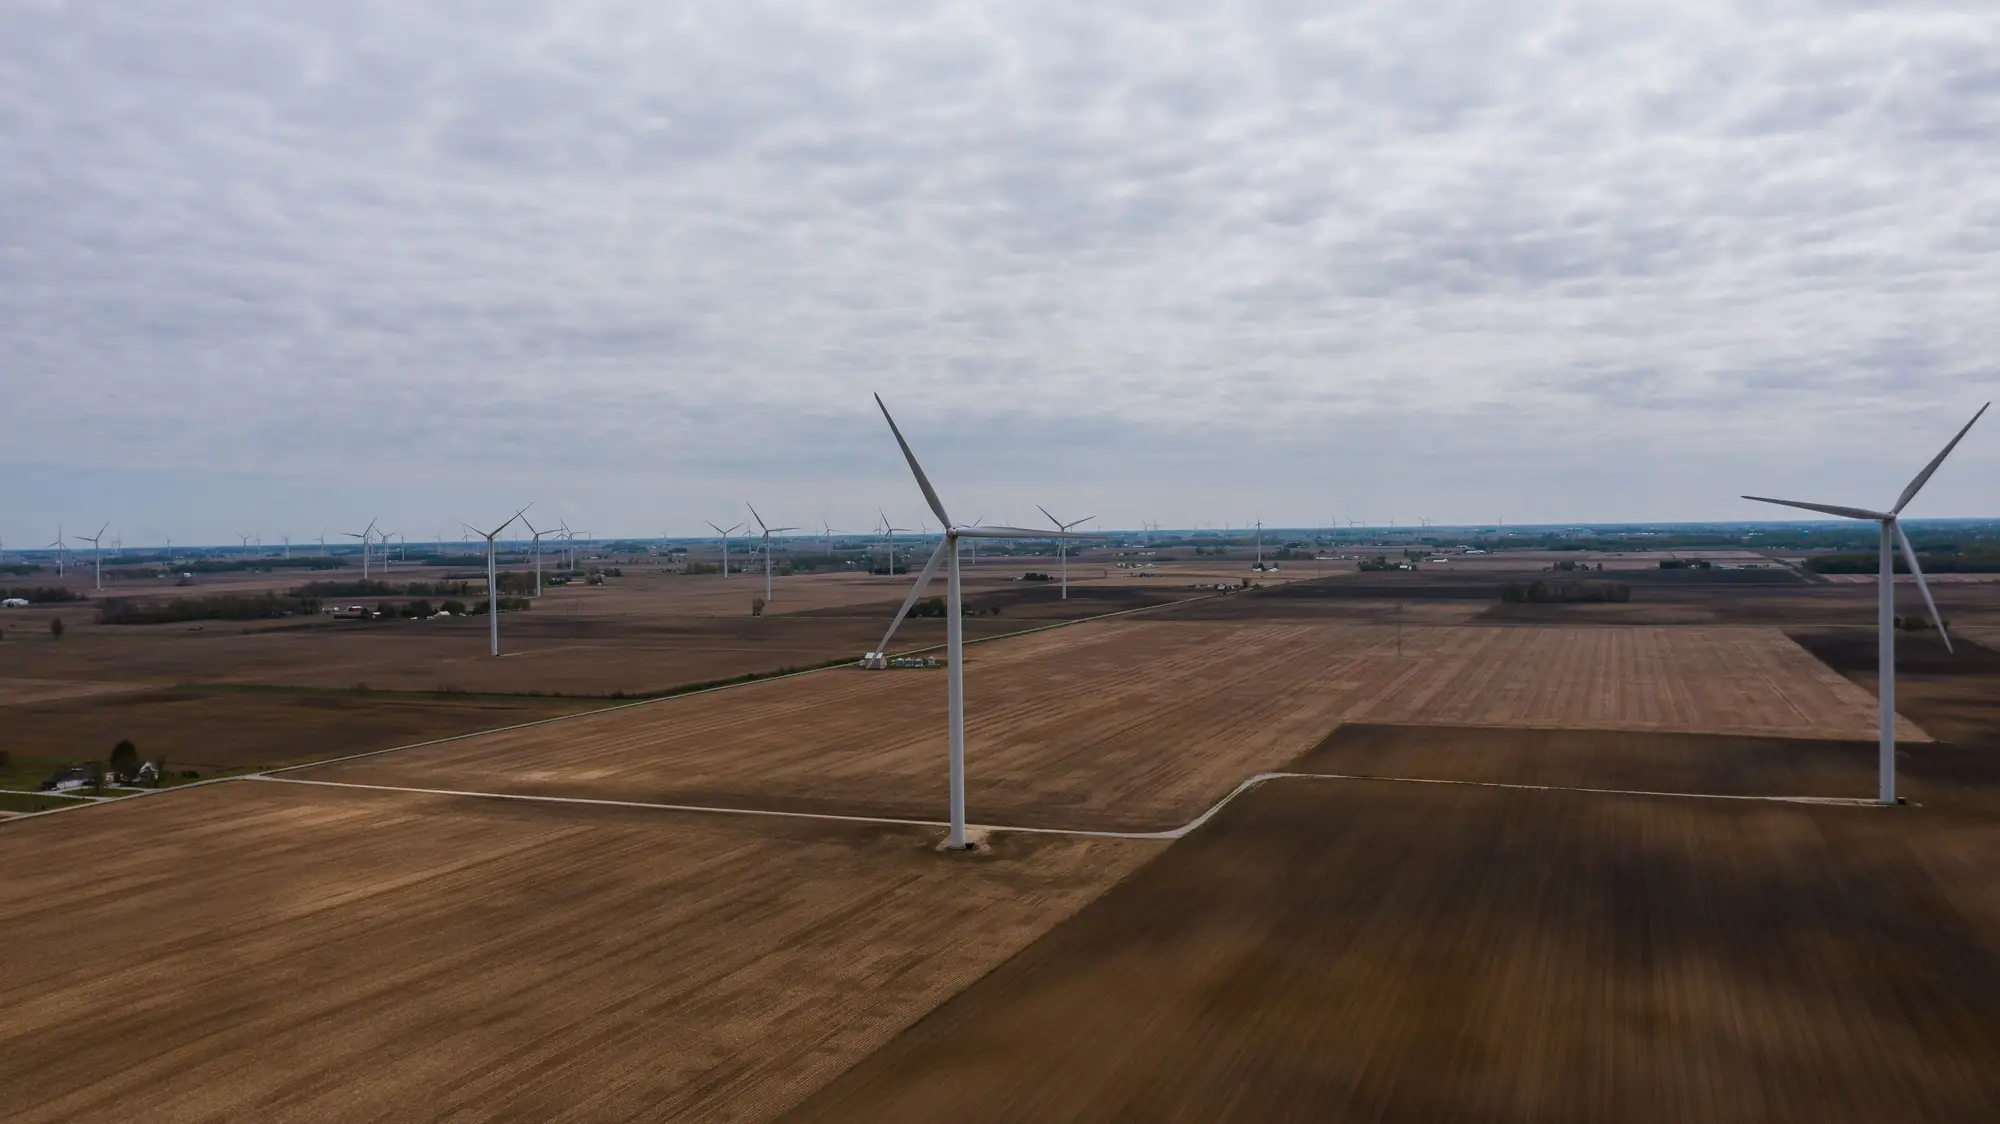
When a candidate site lands on your desk, the first question is usually the simplest one: how many turbines are actually out there, and where exactly are the hubs sitting. Public registries answer that question late and often wrong. A project that broke ground eighteen months ago might still show as "proposed" in a federal turbine database, and self-reported fleet lists from operators lag construction by a cycle or two. So analysts end up doing it the old way: pulling the latest VHR tile and counting by eye.
What you're actually looking for in the imagery
A turbine doesn't look like much from directly overhead. What you're really spotting is a combination of signals: the pad itself (a cleared, often graveled circle or oval at the base), the crane hardstand next to it, the access road spur connecting back to the gravel network, and, depending on sun angle and time of day, the rotor shadow sweeping across the ground. On a clear pass with low sun angle, that shadow is often the easiest thing to pick out, longer and more obvious than the pad.
The order of operations that works:
- Zoom to the AOI boundary first, not the whole county. Candidate sites usually have a defined lease or option boundary, and this keeps you from double-counting a neighboring project's string of turbines that happens to fall in frame.
- Trace the access road network. Turbine pads sit at the ends of spurs off the main gravel road, spaced at roughly consistent intervals set by the turbine model's rotor diameter. If you see a spur with no pad at the end, that's either a met tower or a turbine position that hasn't been built yet.
- Count pads, then cross-check against shadows. Pads confirm a foundation exists. Shadows confirm there's a rotor up and turning (or at least erected) on top of it. A site under construction will often show more pads than shadows.
- Mark hub positions, not pad edges. If you're feeding this into a wake-loss model or a site layout comparison, the coordinate you want is the tower center, not the gravel clearing, which is usually offset and irregular in shape.
Where manual counting breaks down
This works fine for a single 40-turbine site reviewed once. It stops working as a repeatable process the moment you're doing it across a portfolio, or revisiting the same competitor site every quarter to see if they've added a phase. A few things go wrong in practice: analysts miss turbines sitting in imagery shadow or partial cloud cover, hub coordinates get eyeballed instead of measured (which matters a lot once you're running array efficiency or wake-loss calculations downstream), and the whole exercise has to be redone from scratch every time there's a newer tile, because nobody kept the previous count as a structured layer.
The other failure mode is relying on operator disclosures or public turbine databases as your count of record. Those sources are genuinely useful for provenance and ownership, but they're not built for siting work on a quarterly cadence. A competitor site you're tracking for cumulative impact or market share purposes can finish a repower, add a phase, or decommission a string of older machines well before any registry reflects it.
Turning a one-off count into a repeatable layer
If you're doing this across more than a handful of sites, the pad-and-shadow method stops being a quick check and starts being a standing job: someone has to re-trace the same AOIs every time a new image comes in, keep the hub coordinates consistent between passes, and reconcile counts against whatever changed on the ground. Wind Turbine Mapping does that detection and hub-resolution step directly from the rotor shadow and pad geometry, refreshed quarterly, and delivers it as a point layer with coordinates rather than a count you have to re-derive by hand each time.
If you're scoping a candidate site or keeping tabs on a competitor's build-out, it's worth seeing what a current turbine inventory looks like before your next site visit.