USWTDB vs. satellite turbine counts: how current is the public database?
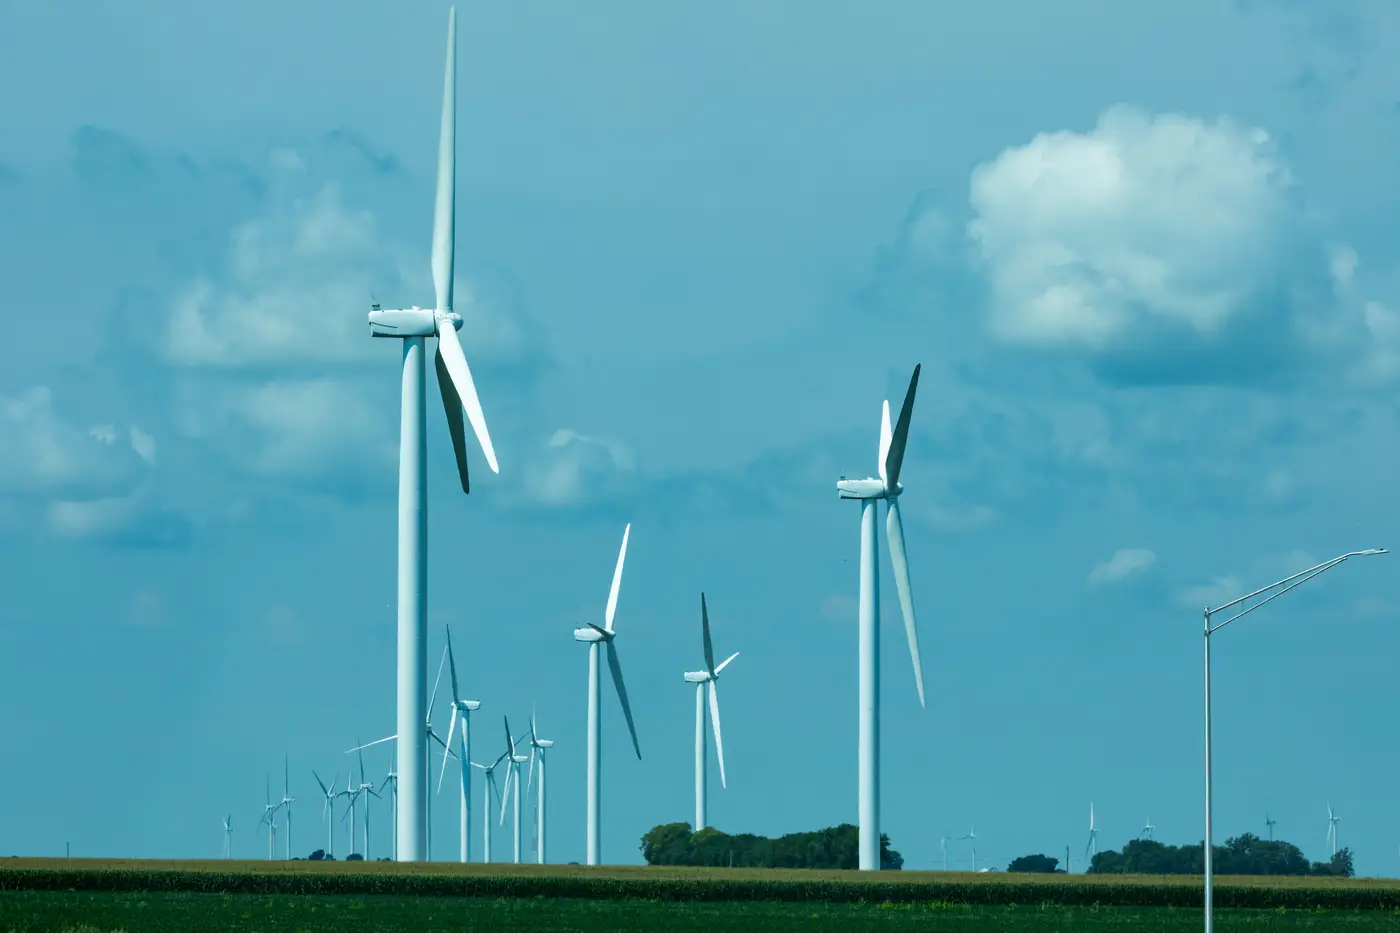
If you've ever pulled the US Wind Turbine Database for a competitor site and then driven past it, you've probably noticed a mismatch. Towers standing in the field that aren't in the file. Pads marked "under construction" that have had blades spinning for two quarters. This isn't a data quality failure so much as a structural lag built into how the database gets filled.
Where USWTDB's numbers actually come from
USWTDB (maintained jointly by USGS, LBNL, and AWEA's successor organizations) is compiled from a mix of sources: FAA permit filings, state and county records, operator-submitted project data, and manual review of aerial imagery by analysts. The manual review step is the bottleneck. A meaningful share of new entries get added only when someone on the database team notices a new cluster in updated basemap imagery and digitizes it by hand, and that queues behind everything else on the team's plate.
The practical result is a lag that typically runs somewhere between one and several quarters from commercial operation date to database entry, depending on how quickly a project files its as-built records and how soon the review team gets to that geography. For a site you're scoping today, the database might be showing you the fleet as it looked two or three quarters ago. For sparsely tracked regions or recent repowering projects, the gap can run longer.
None of this is a knock on the database maintainers. They're running a national registry on a mix of volunteer review and whatever records get filed, and most of what's in there is solid once it lands. The issue for a siting analyst is simpler: if you're doing a wake-loss study or density comparison on a candidate parcel near an operating project, you need the count as it stands now, not as it stood when the last batch of entries got reviewed.
What FAA obstruction data covers and what it doesn't
The other source people reach for is FAA obstruction data, usually the Digital Obstacle File or the 7460 filings tied to permit applications. This has its own blind spots. FAA records exist because a structure needs a notice-of-construction filing for airspace clearance, which means the data is organized around obstruction height and location, not fleet inventory. Decommissioned turbines often stay in the file long after they've been pulled down, because nobody files paperwork to remove an obstruction notice. Repowered turbines, same hub location but taller towers, can show up as duplicate or conflicting entries. Filing timing varies too: some projects file well before steel goes in the ground, others closer to commissioning, so a count built from FAA records alone will skew in the opposite direction from USWTDB, toward turbines that were proposed but never built, mixed in with real ones.
Put the two together and you get a rough triangulation, but both are built from filings and disclosures, which means both inherit whatever lag or gap sits between when something happens on the ground and when someone files the paperwork describing it.
What a satellite-derived count adds
A turbine's rotor shadow and pad geometry show up in imagery the moment the thing is standing and operating, independent of whether anyone has filed a permit update or a reviewer has had time to digitize the new cluster. That's the gap imagery-based counting closes. It reads what's actually built, on whatever cadence the imagery refreshes, rather than waiting on the next records update.
If you're doing a density comparison on a candidate site next to an operating project, or checking a competitor's fleet before a siting decision, that gap is the whole ballgame. A point layer built from current imagery each quarter gives you hub coordinates for what's standing today, not what was standing when the last database refresh happened to catch up with it.
For most portfolio tracking work, cross-checking USWTDB against FAA filings is still a reasonable first pass. It's free, it's public, and it's right more often than not. The question is how much lag your analysis can tolerate before you need a count that isn't waiting on anyone to file paperwork.
Curious what your area of interest looks like right now instead of two quarters ago? That's the gap Wind Turbine Mapping is built to close.