From point layer to wake-loss estimate: a siting workflow
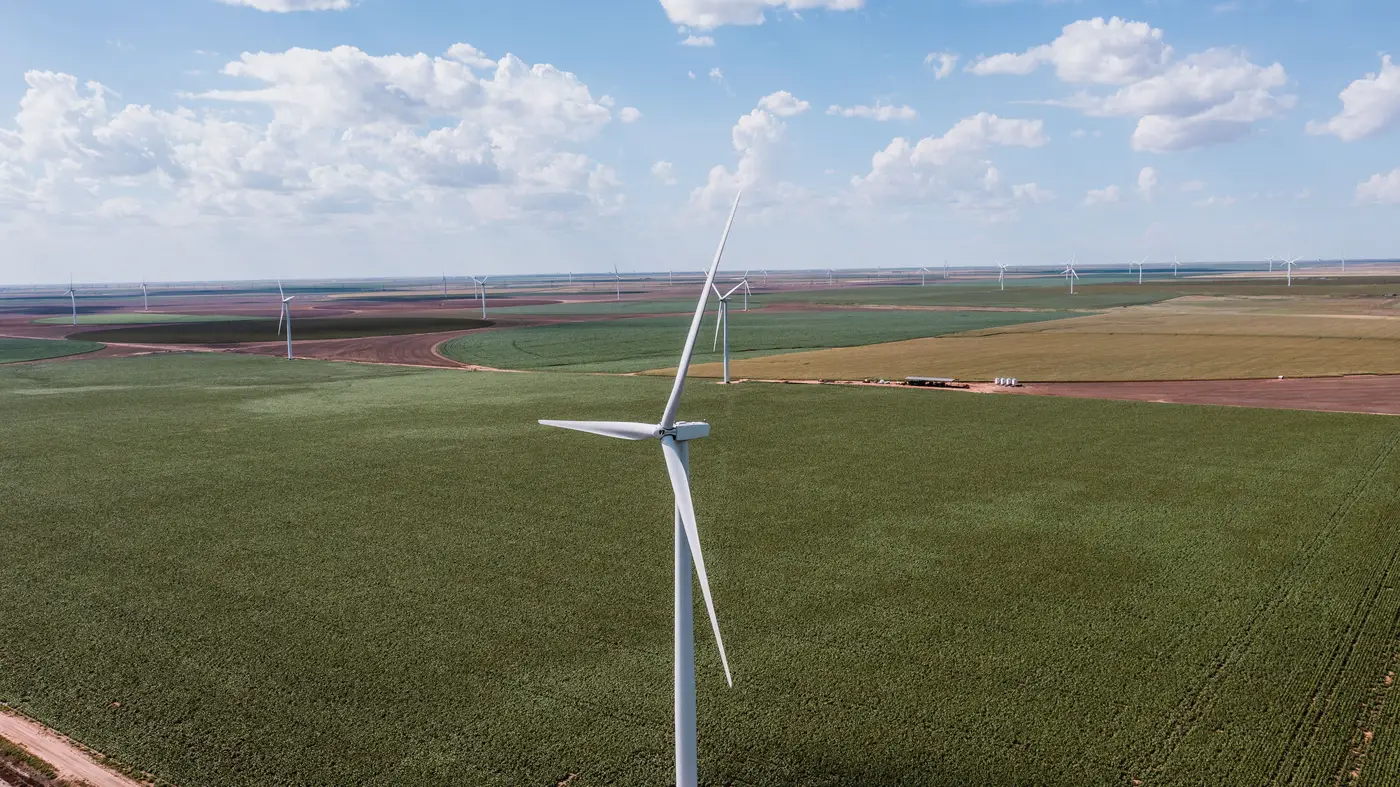
You've got a candidate site, a lease boundary, and a deadline for a preliminary energy yield estimate. Before you can run wake losses you need one thing that's harder to get than it should be: where every existing turbine sits, inside the site and in the ring of competitor projects around it. Not a layout from a 2019 brochure. Not a GIS layer somebody's intern built off Google Earth two years ago. Current hub positions, in coordinates a wake model can ingest.
This is the part of the workflow nobody budgets time for, and it's the part that breaks the schedule when a permitted project three miles upwind turns out to have twelve more turbines than the public registry shows.
What a turbine point layer needs to contain
A usable point layer isn't just dots on a map. For a wake-loss study it needs, at minimum, a hub coordinate per turbine and enough spatial precision that spacing calculations (the D-multiples your wake model cares about, like 7D downwind, 3D crosswind) don't drift by half a rotor diameter just from digitizing error.
Most analysts build this by hand today: load high-res imagery, zoom to each visible turbine, drop a point at the hub, repeat across the AOI. It works. It also takes a day or two per site, and it's only as current as the imagery you happened to license. Turbines get commissioned between update cycles. A site that looked empty in last spring's pass can have a finished phase by fall.
The alternative some analysts use is pulling from operator disclosures or public interconnection filings. Those lists exist for a reason and they're worth checking, but they lag construction by design. A project gets queued, gets built, and the self-reported fleet count doesn't catch up for a reporting cycle or two. For a wake-loss study on a tight timeline, that lag is exactly the gap you can't afford.
Turning hub coordinates into the actual wake-loss number
Once you have clean hub coordinates for your candidate layout and every turbine within wake-relevant range, the modeling step is the familiar part: load the points into whatever engine your team runs, assign turbine specs (hub height, rotor diameter, power curve) by type where known, and let the wake model handle the rest, whether that's a simple Jensen approach for a first pass or something closer to Bastankhah-Porté-Agel for the final report.
The spacing analysis matters more than people give it credit for. Turbine count nearby matters less than exact relative position against the prevailing wind rose. Two turbines 6D apart on the dominant direction lose a lot more than two turbines 6D apart on a direction that barely blows. That's why hub coordinate precision carries through the whole study: a point that's off by 150 meters can shift a turbine from "mostly clear" to "sitting in somebody else's wake" and change your P50 by a meaningful margin.
For a candidate site, this usually means two runs: one using only your own proposed layout, and one layering in every neighboring project, built and permitted, that falls inside wake-relevant distance. The delta between those two numbers is the competitive wake loss, and it's often the number that decides whether a site is still attractive after you account for what's already out there.
Where to get the point layer without the lag
Skipping the manual digitizing and the registry lag in one move is possible: Wind Turbine Mapping locates turbines from rotor shadow and pad geometry directly in satellite or aerial imagery and delivers a point layer with hub coordinates, refreshed quarterly, so the fleet map going into your wake-loss run reflects what's standing on the ground now, built from imagery rather than filed paperwork.
If you're scoping a candidate site this quarter, it's worth seeing what a current fleet map looks like for your area of interest.