How to measure turbine spacing from satellite imagery
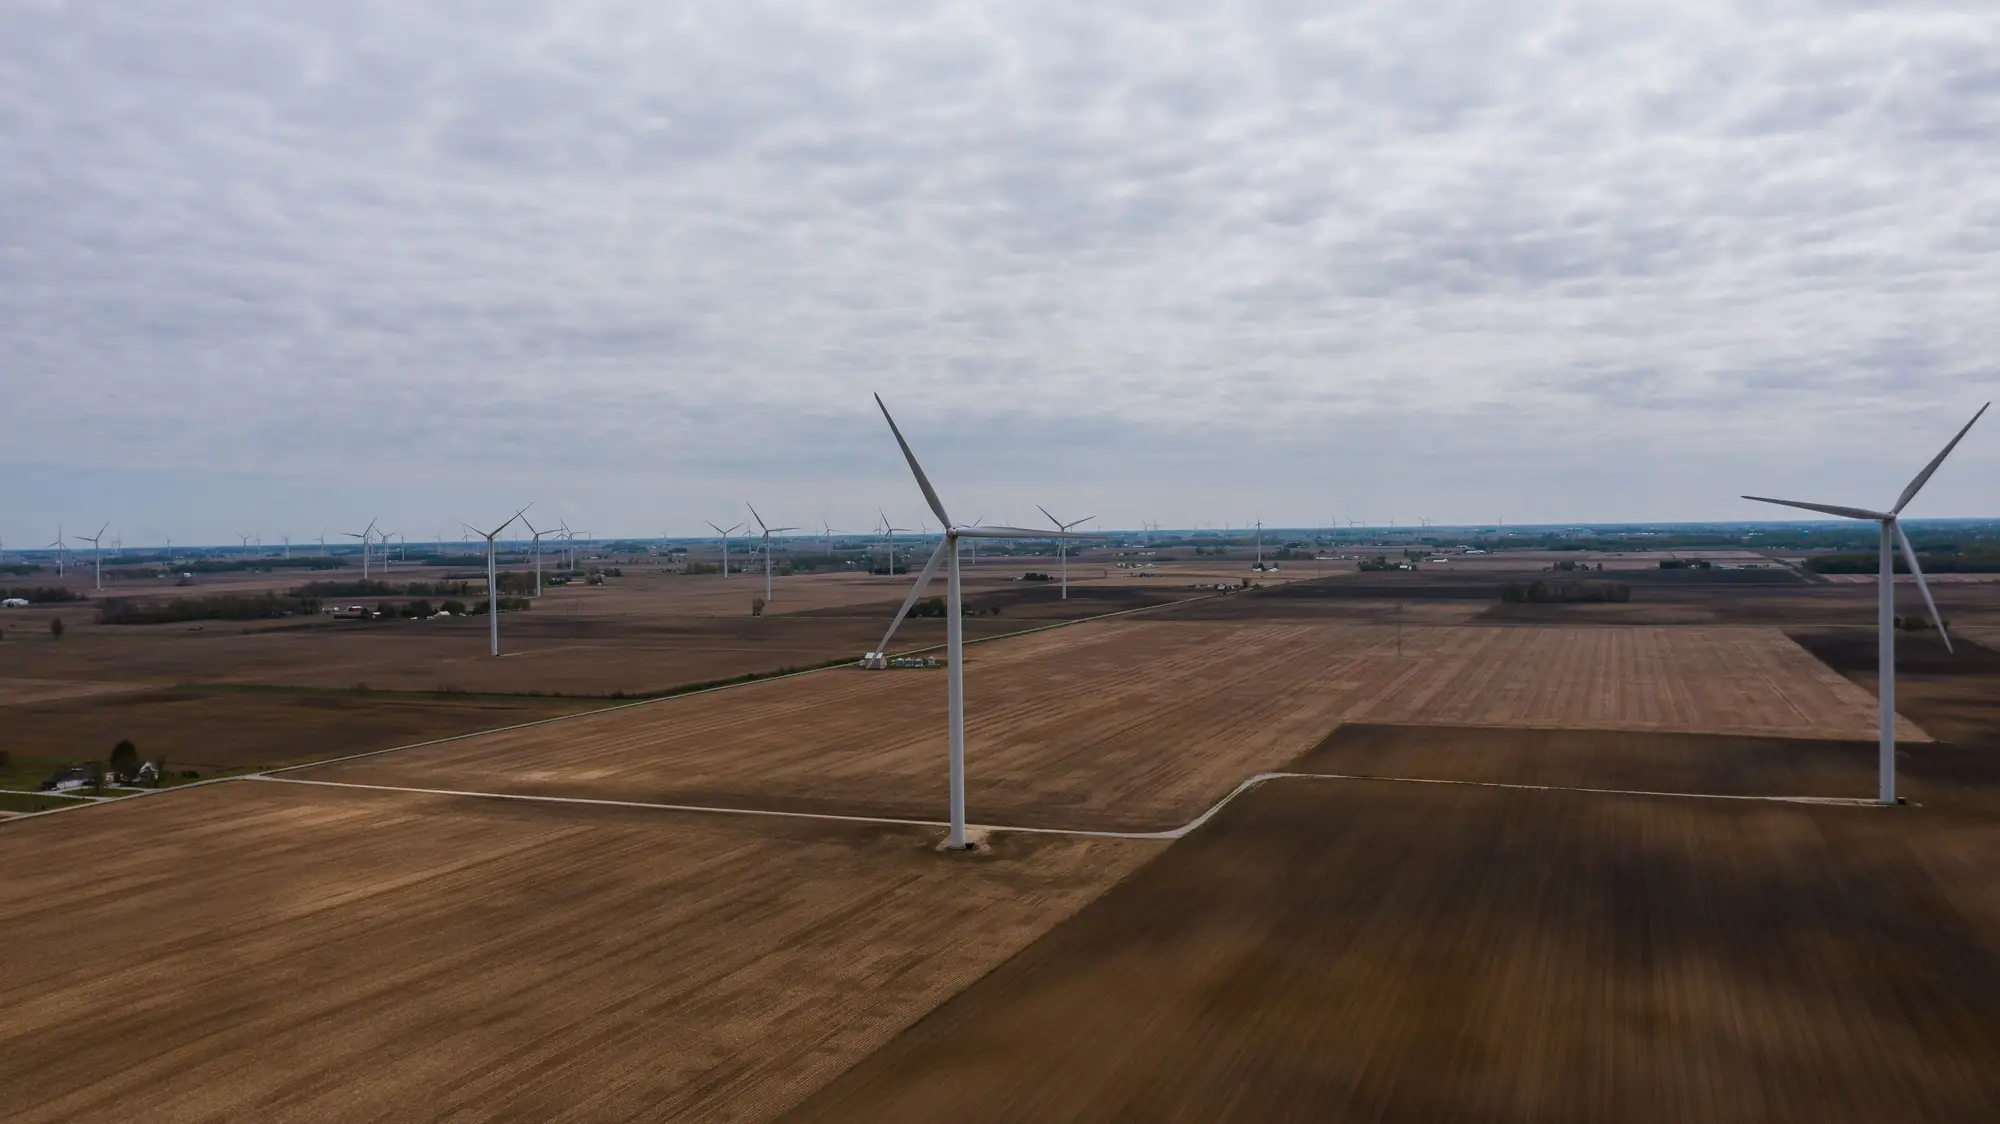
Pulling turbine spacing off imagery sounds like a ruler exercise until you try it on a messy site with staggered strings and a ridge line cutting through the layout. Here's what works in practice, and where it falls apart.
Start with the pixel, not the turbine
A 0.5 m GSD image gives you roughly two pixels across a typical access road and maybe six to eight across a turbine pad. That's enough to place a hub center by eye, but spacing analysis asks you to measure distances between dozens of those points consistently, across an array that might run fifteen or twenty turbines deep. Eyeballing hub centers off a basemap works fine for a single pair. It stops working once you're comparing spacing across an entire project, or stacking a competitor's layout against your own candidate site.
There's also a gap between what you see and what you need. What shows up in the image is rarely the hub itself. It's the rotor shadow, the crane pad, and sometimes a nacelle shadow depending on sun angle and capture time. An analyst has to infer the hub position from that geometry, and two people digitizing the same image by hand will often land a meter or two apart on each point. Across a 60-turbine site, those small offsets stack up fast once you're trying to validate a spacing pattern against a design standard.
The rotor diameter rule, and where it stops being a shortcut
Most siting teams carry a rule of thumb: 3D to 5D crosswind, 7D to 10D downwind, where D is rotor diameter. It's a decent sanity check when you're scoping a new area from a distance. The rule runs into trouble the moment you try to apply it backward, inferring turbine model from spacing alone. A 3.5 MW machine with a 150 m rotor and a 4.8 MW machine with a 162 m rotor can produce nearly identical spacing patterns on the ground, and ridge-top sites routinely compress or stretch the standard spacing to work around terrain, setback lines, or an existing substation tie-in. Spacing tells you a project was engineered for wake losses. Turbine class is a separate question geometry alone won't answer.
Turbine row spacing from imagery is its own measurement problem, distinct from pad-to-pad spacing. A "row" in developer language usually means a string following a ridge or the prevailing wind direction, and real projects rarely lay out in clean rows at all. Most are staggered strings that bend with terrain contours, so measuring row spacing means first deciding where the rows run on the ground, then measuring perpendicular distance between strings rather than just nearest-neighbor distance within one.
Building a spacing dataset you can compare across sites
Once you have hub coordinates for every turbine in the area of interest, inter-turbine spacing analysis is just geometry from there: nearest-neighbor distance, average spacing by compass sector, spacing normalized against a known or estimated rotor diameter. Getting consistent, complete hub coordinates for a site you don't operate, and can't pull a layout drawing for, is the hard part. Especially on a competitor's project, or a site where the interconnection filing lags two years behind what's actually standing in the field.
That's the gap Wind Turbine Mapping is built around. It locates every turbine in an area of interest from rotor shadow and pad geometry and resolves each hub's position into a point layer with hub coordinates, refreshed quarterly, so a site that's mid-construction this quarter shows up filled in by the next.
If you're scoping spacing on a candidate site or benchmarking a competitor's array, pull the fleet map and measure from coordinates instead of a screen ruler.