How to tell an operating turbine from a decommissioned one in satellite imagery
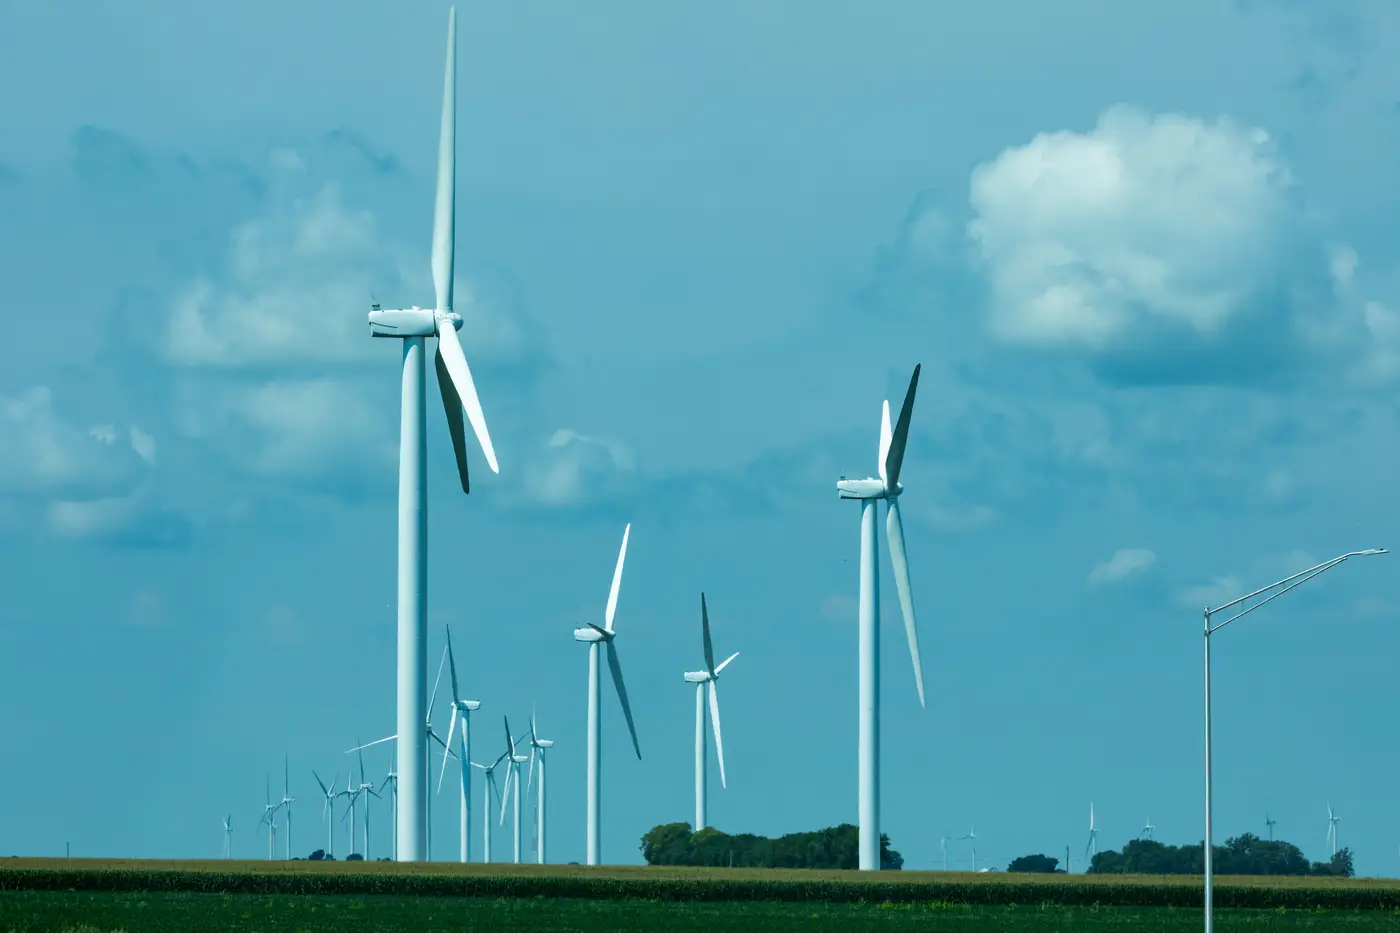
Public turbine registries lag construction by a year or more, and they lag decommissioning even longer. Nobody files paperwork the day a turbine stops spinning. So if you're scoping a competitor site or checking whether a county's published fleet count still matches reality, you end up doing the same thing every siting analyst has done at some point: squinting at imagery and trying to work out which towers are live.
There's no single tell. You're reading a combination of signals, and some sites give you three or four at once while others give you one weak hint and nothing else.
The clearest signals
Missing or partial rotor. The most obvious case is a tower with no blades, or a nacelle sitting on top of bare steel. At 0.5 m GSD you can usually tell whether a hub has a rotor assembly attached or not, especially with a clean shadow to confirm the silhouette. A tower casting a tower-only shadow, no blade sweep, is either mid-repower or fully retired.
Blade staging on the ground. Decommissioning crews don't always haul blades off site immediately. Long pale shapes laid out near the pad, sometimes stacked, sometimes cut into sections for transport, mean the turbine came down recently. Fresh imagery catches this window; a quarter later the blades are gone and so is the evidence.
Crane pads and laydown yards. Repowering looks different from retirement on the ground. A site getting new turbines shows a graded crane pad next to the old foundation, component laydown areas, and often a wider or re-graveled access road built to handle longer blade sections. A site going cold shows the opposite: roads narrowing as they revegetate, no vehicle traffic, no staging.
Access road condition. This one takes patience but it's reliable over a sequence of passes. An operating turbine gets visited for maintenance, which means tire tracks, a maintained gravel surface, and vegetation kept back from the shoulders. A dead turbine's road grows in. Grass and scrub start closing over the two-track within a season or two in most climates, faster in wet ones.
Softer signals, read in combination
Shadow direction only shows where the blades sat when the satellite passed overhead. A feathered or stopped rotor in a single frame usually just means a quiet moment: curtailment for grid conditions, a maintenance window, bat and bird protocols, or low wind at flyover time. The useful read comes from comparing the same hub across multiple passes: a rotor that's in a different position every quarter is being used; a rotor frozen in the same orientation pass after pass, especially with the access road closing in underneath it, points the other way.
Pad condition matters too. A maintained operating pad usually shows a clear gravel apron with sharp edges. A long-idle pad starts showing cracks with vegetation pushing through, or standing water pooling where drainage used to be kept clear.
None of these signals is proof on its own. A turbine can sit feathered for weeks during a planned maintenance campaign and look identical to a retired one in a single frame. The read gets reliable when you stack signals: no blades plus a closing-in road plus a frozen shadow position across three quarters is a different confidence level than any one of those alone.
Why this matters for site scoping
If you're sizing a wake-loss study or checking a competitor's claimed fleet count against what's actually standing, a registry that was accurate eighteen months ago isn't good enough. Repowered sites are the worst case for stale data, because the pad is occupied by a newer, taller machine with a different hub height and rotor diameter than whatever's on file, and the old permit record never gets corrected.
Working through this hub by hub across a large AOI, especially across a portfolio with sites in several states, is slow and it's easy to miss a repower that happened between your last two imagery pulls. Wind Turbine Mapping builds a point layer of every hub location refreshed on a quarterly cadence, so a fleet count reflects what's standing now instead of what a disclosure said last year.
If your next siting review needs a current hub count instead of a guess built from old filings, that's the gap this tool is built to close.